
100% Job Guarantee
Applied Business Data Analytics
BizIntel
Kickstart your career with the best Data Analytics course covering data visualization, business intelligence, SQL, Python, and real-world analytics projects.


4.8 out of 5
Companies hiring
skilled professionals


What Sets You Apart
Your Edge
with Arivz
We bridge learning and career success. Learn job-ready skills, build real-world projects, and get personalized support to land your dream tech jobs.
Live Classes with Experts
Learn from real industry pros in UI/UX, Data Analytics and more who know the game.
Personalized Dashboard
Stay connected with learning materials, updates, and resources, lifetime forever.
On-Demand Training
Get hands-on experience with essential tools even after course completion.
Boost Your Career with
Personalised Support
Dedicated Mentorship
Get personalised help and smooth guidance throughout your learning journey.
Career Guidance
Includes resume building, LinkedIn optimization, mock interviews, and soft skills.
Guaranteed Interviews
Secure interviews within 90 days of course completion or get 100% Refund.

100+
Enrolled
77%
Completion
17
Placement
Drives
34
Workshops
This Course is
Perfect for
Beginners starting a data analytics career,
Non-tech professionals transitioning to analytics,
Business, marketing & finance professionals upskilling,
Students & graduates entering the data industry.
Apply for Roles
Like
Data Analyst,
Business Analyst,
Marketing Analyst,
Financial Analyst,
Operations Analyst,
BI (Business Intelligence) Analyst, and more.
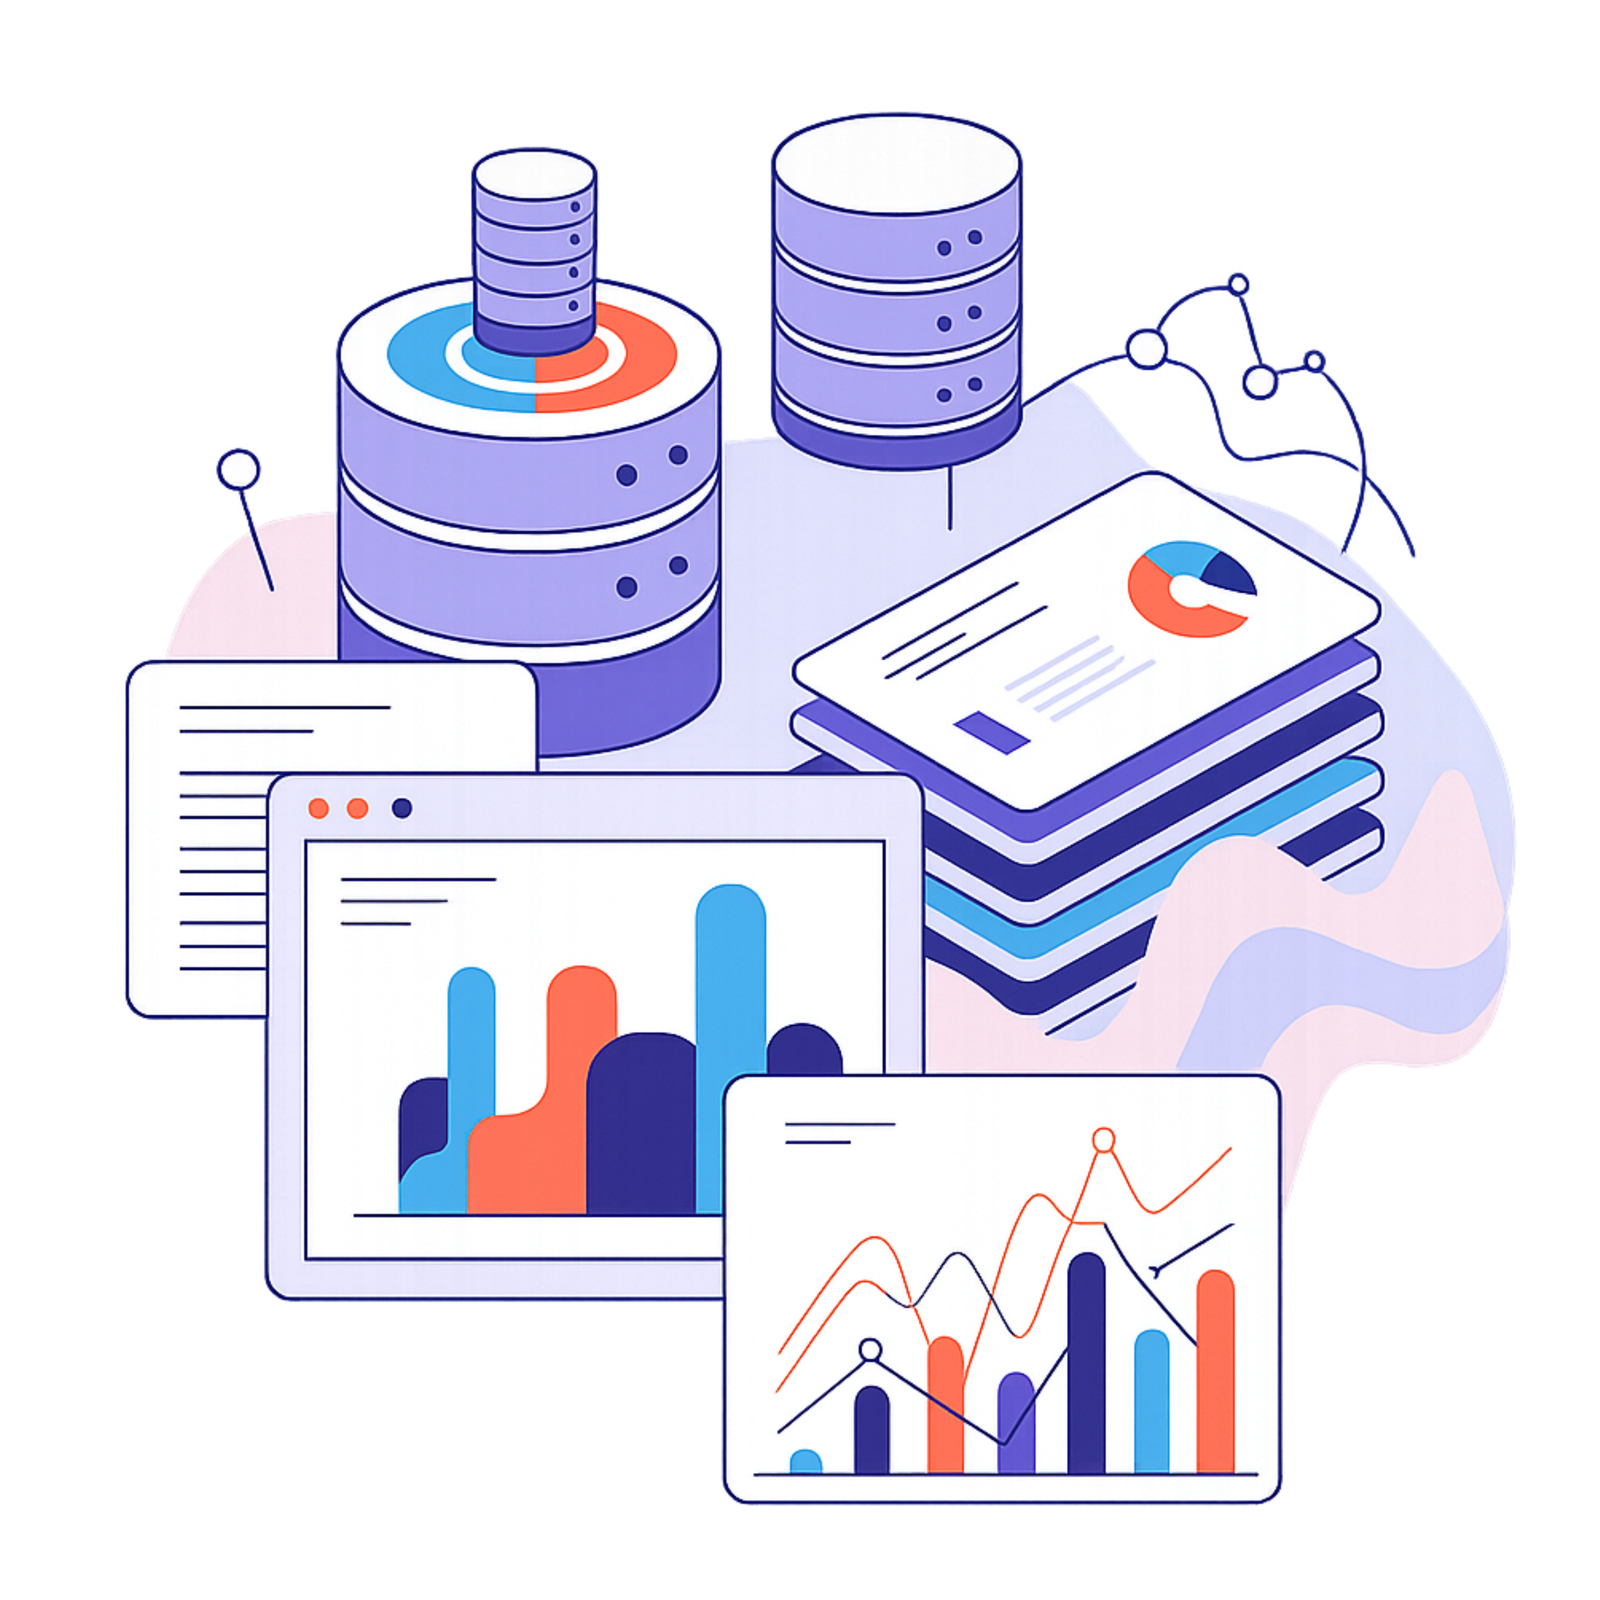
What
You'll Learn
Gain hands-on skills in data analysis, data visualization, and business intelligence. Learn tools like Excel, SQL, and Tableau, and build a job-ready portfolio with real-world projects.


Sprint 1
Foundations of Business Data Analytics
Introduction to Business Analytics
- What is Business Data Analytics?
- The role of analytics in decision-making.
- Types of Analytics: Descriptive, Predictive, and Prescriptive.
Understanding Data
- Types of Data: Structured, Semi-Structured, and Unstructured.
- Data Collection Methods and Data Sources.
- Data Quality: Accuracy, Completeness, Consistency.
Sprint 2
Data Manipulation and Visualization
Excel for Business Analytics
- Pivot Tables, VLOOKUP, HLOOKUP.
- Advanced Formulas: IF, SUMIFS, INDEX-MATCH.
Data Visualization with Excel
- Creating Charts: Bar, Pie, Line, Waterfall.
- Dashboards and Automated Reporting.
Introduction to Tableau and Power BI
- Connecting Data Sources.
- Creating Interactive Dashboards.
- Advanced Visualizations (e.g., Heat Maps, Tree Maps).
DAX (Data Analysis Expressions) for Power BI
- Introduction to DAX: Syntax and Basic Functions.
- Aggregation Functions: SUM, AVERAGE, COUNT.
- Logical Functions: IF, SWITCH.
- Time Intelligence Functions: TOTALYTD, SAMEPERIODLASTYEAR.
- Calculated Columns and Measures.
Sprint 3
SQL for Data Analytics
Introduction to Databases
- Basics of Relational Databases.
- ER Diagrams and Schema Design.
SQL Basics
- SELECT, WHERE, GROUP BY, ORDER BY.
- Joins: INNER, OUTER, LEFT, RIGHT.
Advanced SQL
- Subqueries, Common Table Expressions (CTEs).
- Window Functions.
Creating and Managing Views.
Sprint 4
Introduction to Programming for Analytics (Python)
Python Basics
- Variables, Data Types, and Operators.
- Conditional Statements, Loops, and Functions.
Data Handling with Python
- Introduction to Libraries: Pandas, NumPy.
- Data Cleaning: Handling Missing Values, Outliers.
- Data Transformation: Filtering, Sorting, Aggregations.
Basic Visualizations
- Introduction to Matplotlib and Seaborn.
- Plotting Bar Charts, Line Charts, and Scatter Plots.
Sprint 5
Advanced Data Analysis and Statistical Techniques
Descriptive Statistics
- Measures of Central Tendency: Mean, Median, Mode.
- Measures of Spread: Variance, Standard Deviation, Quartiles.
Inferential Statistics
- Hypothesis Testing: T-Test, Chi-Square Test.
- Confidence Intervals.
Regression Analysis
- Simple and Multiple Linear Regression.
- Evaluating Model Performance (R², Adjusted R²).
Time Series Analysis
- Trend Analysis, Seasonality, Moving Averages.
- Forecasting Models: ARIMA.
Sprint 6
Machine Learning for Business Analytics
Introduction to Machine Learning
- Supervised vs. Unsupervised Learning.
- Business Use Cases for Machine Learning.
Supervised Learning
- Classification Models: Logistic Regression, Decision Trees.
- Regression Models: Linear Regression, Polynomial Regression.
Unsupervised Learning
- Clustering: K-Means, Hierarchical Clustering.
- Dimensionality Reduction: PCA.
Sprint 7
Capstone Projects and Portfolio Development
Work on real-world projects, build your portfolio, and prepare for job interviews.
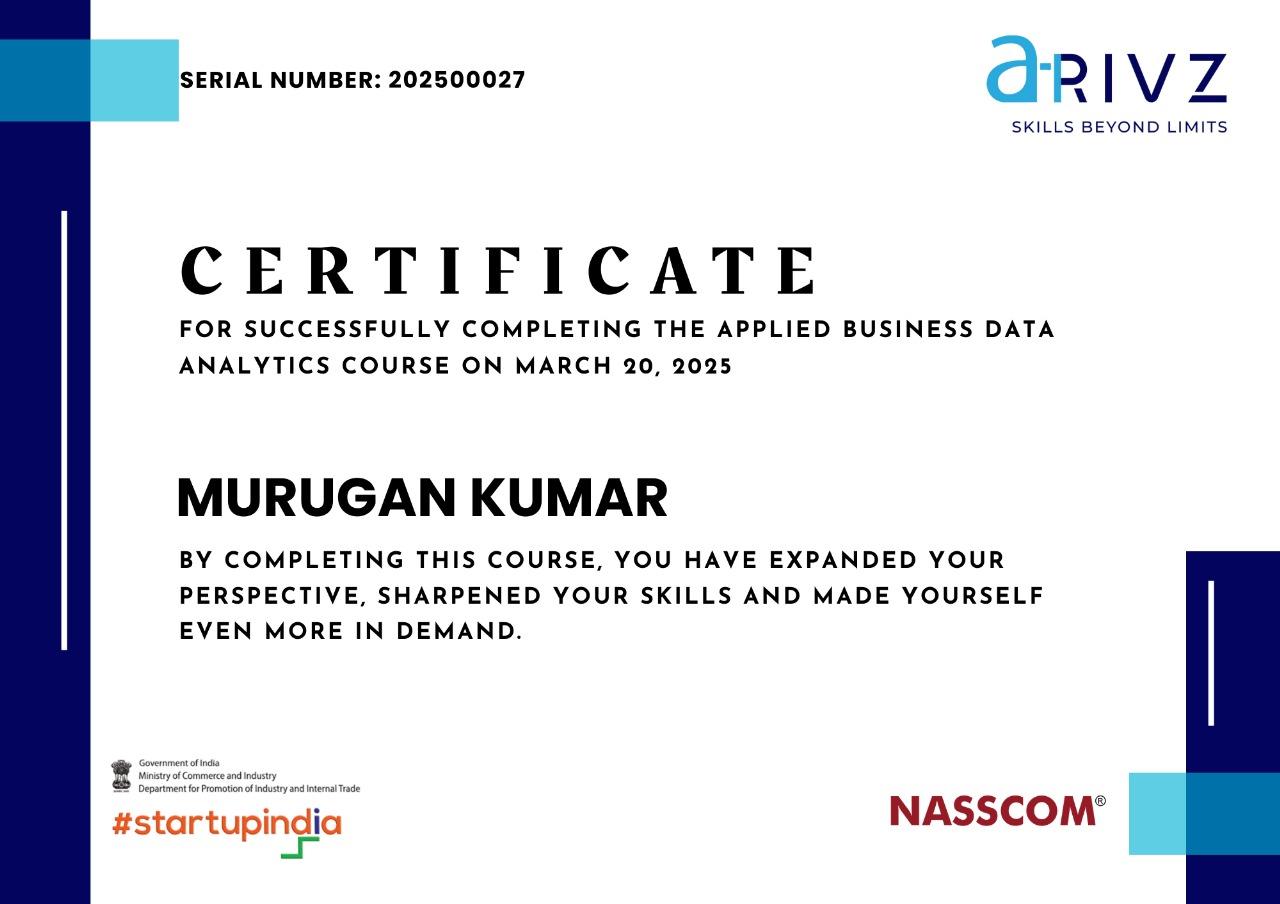
Get Certified,
Get Noticed
Show off your skills with an industry-recognized Data Analytics certification. Upon course completion, you’ll receive a professional certificate to boost your resume and prove you’re job-ready.
Testimonials
Hear It from
Our Community
Your career transition could start here with Arivz. Become the Next person to experience success.
Trustindex verifies that the original source of the review is Google. Choosing Arivz for my AI learning journey was the right decision. Their curriculum is perfectly balanced between theory and practice. With their help, I was able to land a role as a junior AI engineer. Thank you, Arivz!Trustindex verifies that the original source of the review is Google. One of the best training center in Chennai, go extra mile to place the candidates. Appreciate your commitment. All the best.Trustindex verifies that the original source of the review is Google. Great platform to upskill. I joined the Data Science program and now I'm working at a reputed company.Trustindex verifies that the original source of the review is Google. Arivz Institute is great! The mentors are punctual and explained everything clearly - fees, course details, and more. The classes are very practical, and they cleared all my doubts. I'm really happy with the learning experience. Highly recommend for both freshers and experienced professionals looking to upskill or reskill!Trustindex verifies that the original source of the review is Google. If you're serious about a career in tech, Arivz is the place to go. They deliver what they promise. I was able to switch careers thanks to Arivz. The placement guarantee is real and effective.Highly recommended for anyone looking to get into IT. The training and placement support are top-notch.Trustindex verifies that the original source of the review is Google. Completed the UI/UX course at Arivz. Loved the hands-on approach and real-time projects.Trustindex verifies that the original source of the review is Google. Fantastic training environment. The instructors were approachable and always ready to help.Trustindex verifies that the original source of the review is Google. Really good experience with institute The institute offers a wide range of computer education programs, from basic computer literacy to advanced programming and software development courses. The curriculum is well-structured and keeps up with current industry trends, which I found especially useful.Trustindex verifies that the original source of the review is Google. I had an amazing learning experience with Arivz. The trainers are real industry experts and the content is very practical.Verified by TrustindexTrustindex verified badge is the Universal Symbol of Trust. Only the greatest companies can get the verified badge who has a review score above 4.5, based on customer reviews over the past 12 months. Read more
Invest in your future,
Not All at Once
Flexible payments, focused learning.
Basic Plan
₹60,000
25% OFF
₹45,000
Register with Just
₹2,000
and pay the rest later in 3, 6, or 9 months with the No-cost EMI options
Premium Plan
₹80,000
25% OFF
₹60,000
Premium Features for Our
Premium Learners
Lifetime Dashboard Access
On-Demand Tool Training (1-year) after course
Dedicated Success Manager
Guaranteed Interview Opportunities
Get In Touch
Book Your
Free Counselling Session
Got questions about starting a career in UI/UX Design, Data Analytics, Full Stack Development or more?
Let’s take the next step toward your tech career together!
Land Your Dream Job
or get Your Money Back

FAQ
Explore answers to common questions to launch your tech career with confidence.
No prior experience is required, but a basic understanding of mathematics and logical reasoning will be helpful.
You will work with Excel, Google Sheets, MySQL, Tableau, Power BI, Python, and Scikit-learn.
Yes! The course includes multiple real-world projects and a capstone project to apply your learning.
Absolutely! We cover programming for analytics from scratch using Python.
Personalized career guidance, resume building, LinkedIn optimization, mock interviews, and soft skills training. Premium learners also receive guaranteed interview opportunities.